Fact Check | Iowa leads the nation in overall high-school graduation rates, lags behind in minority graduation rates
Statements by Iowa Gov. Kim Reynolds and other Iowa Republicans praising graduation rates and overall academic performance among K-12 schools in the state are not without factual basis, though Iowa graduation rates among minority populations fall behind nationally.
May 29, 2020
PolitiFact Iowa is a project of The Daily Iowan’s Ethics & Politics Initiative and PolitiFact to help you find the truth in politics.
Edited by Lyle Muller and Sarah Watson
If your time is short:
- Iowa Gov. Kim Reynolds says Iowa has the highest high-school graduation rate in the country, echoing the sentiments of many other Republican politicians in the state.
- Since 2011, Iowa’s graduation rate has for the most part steadily increased and reached a record high of 91.6 percent in 2019.
- Iowa is No. 1 in the nation for overall high-school graduation rates, but falls short of other states for graduation rates among minority populations.
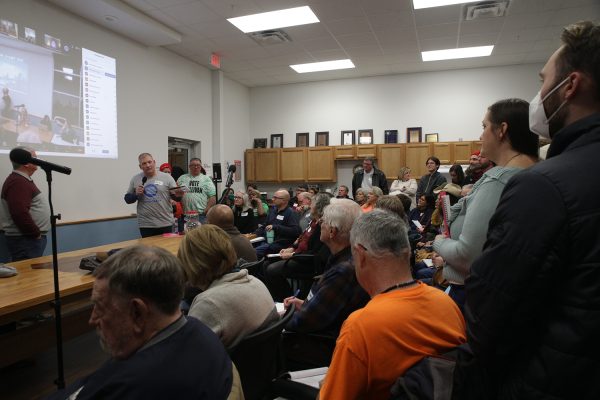
Back at the beginning of the year, before COVID-19 altered the state’s school calendar, Iowa Gov. Kim Reynolds praised public schools in her January Condition of the State address for having “the highest high-school graduation rate in the country.” It’s a popular sentiment that other Iowa politicians second — most notably Republicans when touting their state funding record for public schools.
RELATED: Iowa Gov. Kim Reynolds closes K-12 schools for the rest of the academic year
For example, Sen. Amy Sinclair, R-Allerton, made similar comments in a Cedar Rapids Gazette article from February, in which she defended increased state funding for K-12 schools. Sinclair told the newspaper Iowa’s schools have the nation’s highest high school graduation rates but also score well enough in national testing and have a reputation for being the best in the nation.
We checked high-school graduation data from the National Center for Education Statistics and found these statements have a factual basis. Iowa graduation rates have increased steadily over the past decade, from 88 percent in the 2010-11 academic year to 91 percent in 2016-17. The rate took a marginal dip between 2015-16 and 2016-17, from 91.3 percent to 91 percent.
Iowa ranked No. 1 in the nation for graduation rates from 2011 to 2017, often ahead of runner-up states such as New Jersey, Nebraska, and Wisconsin by a full percentage point, according to a Daily Iowan analysis of NCES data.
“We do need to be proud of our graduation rate, and our schools are working incredibly hard,” Iowa State Education Association President Mike Beranek said in an interview with the DI April 30. “ … our statistics are really quite the envy of many other states in the country.”
Beranek said he doesn’t expect Iowa’s graduation rates to be affected negatively by school closures during spring as a result of the COVID-19 pandemic. However, he said he believes the shift from in-person to virtual instruction in many state schools could shed light on inequities within Iowa.
RELATED: Iowa City schools go virtual in first week of online instruction
He pointed to varying access to internet, food, and transportation among students as examples of inequity within the education system.
“While we do have a discrepancy between those students who are in poverty and those students who aren’t, it’s still lower than a majority of states in the country,” Beranek said. “And I’m hopeful that our districts are doing everything they can to ensure that doesn’t widen but it narrows — and that’s a goal of our districts in Iowa is to continue to narrow that gap.”
According to numbers from the NCES, graduation rates for black and Hispanic populations in Iowa were 82 percent and 82.4 percent in 2016-17, respectively — compared to a 92.7 percent graduation rate among the state’s white population and an overall state graduation rate of 91 percent. Iowa ranked 13th and 12th in the nation for black and Hispanic graduation rates, respectively.
Iowa was the 11th state in the nation for graduation rates among students with disabilities at 74.3 percent, and eighth in the nation for economically disadvantaged students at just over 83 percent in 2016-17, according to NCES data.
Iowa’s high-school graduation rate reached a record high of 91.6 percent in 2019, according to a March press release from the Iowa Department of Education. Graduation rates in the state have increased 3.3 percentage points overall, 9.3 percentage points for Hispanic students, and 8.4 percentage points for African American students since 2011, the release stated.
“Iowans should be proud of our consistent, upward trend in graduation rates,” Iowa Department of Education Director Ryan Wise wrote in the press release. “Schools are also ensuring students are prepared to succeed beyond graduation by making classwork relevant and engaging through career academies, college credit and work-based learning opportunities that help students connect what they are learning to postsecondary opportunities.”
Our ruling
Reynolds, Sinclair, and additional Iowa politicians said Iowa has the nation’s highest graduation rates in the U.S. National data confirms these statements and shows a steady increase in Iowa’s graduation rates since 2011. Graduation rates among minority populations in Iowa are relatively low compared to those of other states, however, and none surpassed 85 percent in 2016-17. We rated the claim of leading the nation in education as Mostly True.
Sources
Phone interview with Iowa State Education Association President Mike Beranek
Cedar Rapids Gazette: Senate passes 2.1 percent increase in education funding
Office of the Governor of Iowa: Gov. Reynolds Delivers Condition of the State
Iowa Department of Education: Iowa’s high school graduation rate reaches record high of 91.6 percent
National Center for Education Statistics: Public high school 4-year adjusted cohort graduation rate (ACGR), by race/ethnicity and selected demographic characteristics for the United States, the 50 states and the District of Columbia: School year 2010-11 to 2012-13, 2013-14, 2014-15, 2015-16, 2016-17